Introducing user states in product analytics
The simplest model to measure your product performance
It all started about a year ago. I was recording a video with the awesome Juliana Jackson about e-commerce analytics setups. At some point, we got into discussing user journeys in e-commerce. Juliana made this fascinating observation: in e-commerce analytics setups, we usually only look at the last user journey—the final buying conversion—and we optimize everything for that.
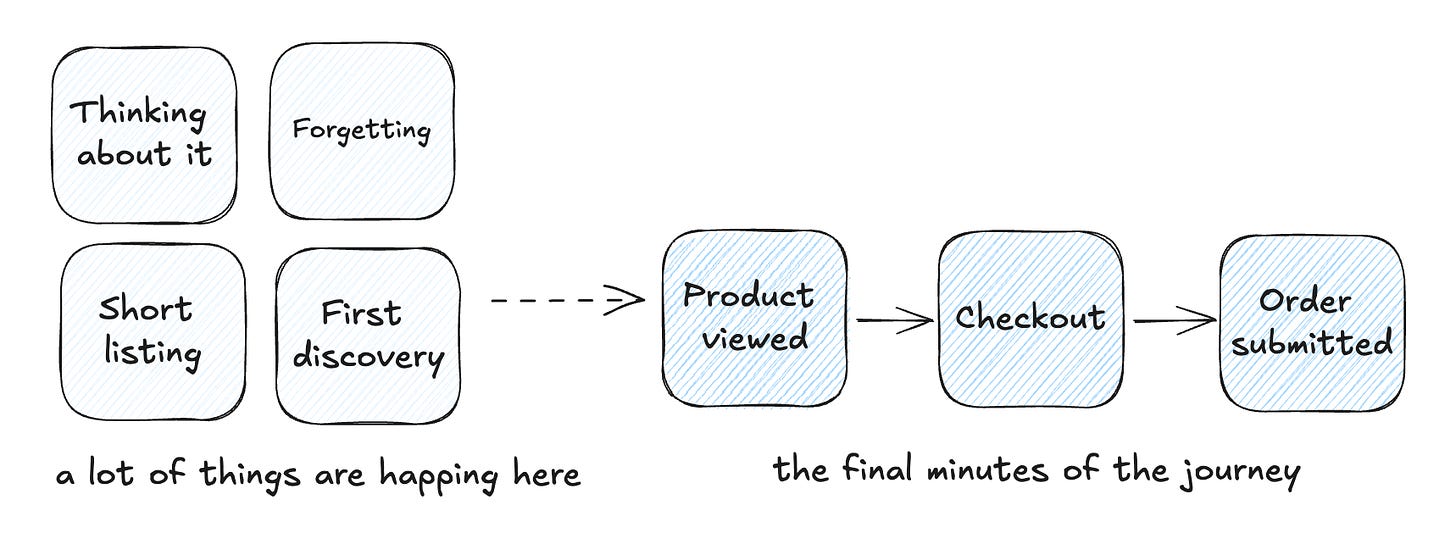
You'll always see one funnel when you look at an analytics setup for an e-commerce shop. It typically starts somewhere on a product detail page, goes to checkout, and ends up in an order. But here's the thing—plenty more user journeys before that final purchase.
Sure, there are a few things we buy right away—maybe a toothbrush because we need one. For those, the single funnel makes sense. But for most other stuff we buy, it's a whole different story.
Think about the last expensive thing you bought. My buying journey can sometimes take months. I go through all these different stages: from "That could be interesting" to "I forgot about it" to "Oh, that's interesting again." Then it's "let's do some research" to "Okay, I've narrowed down the options" to "I have a favorite" to "Should I buy that?" This can sometimes take weeks, even months, until I finally hit "okay, I'm ready. I'm buying it now."
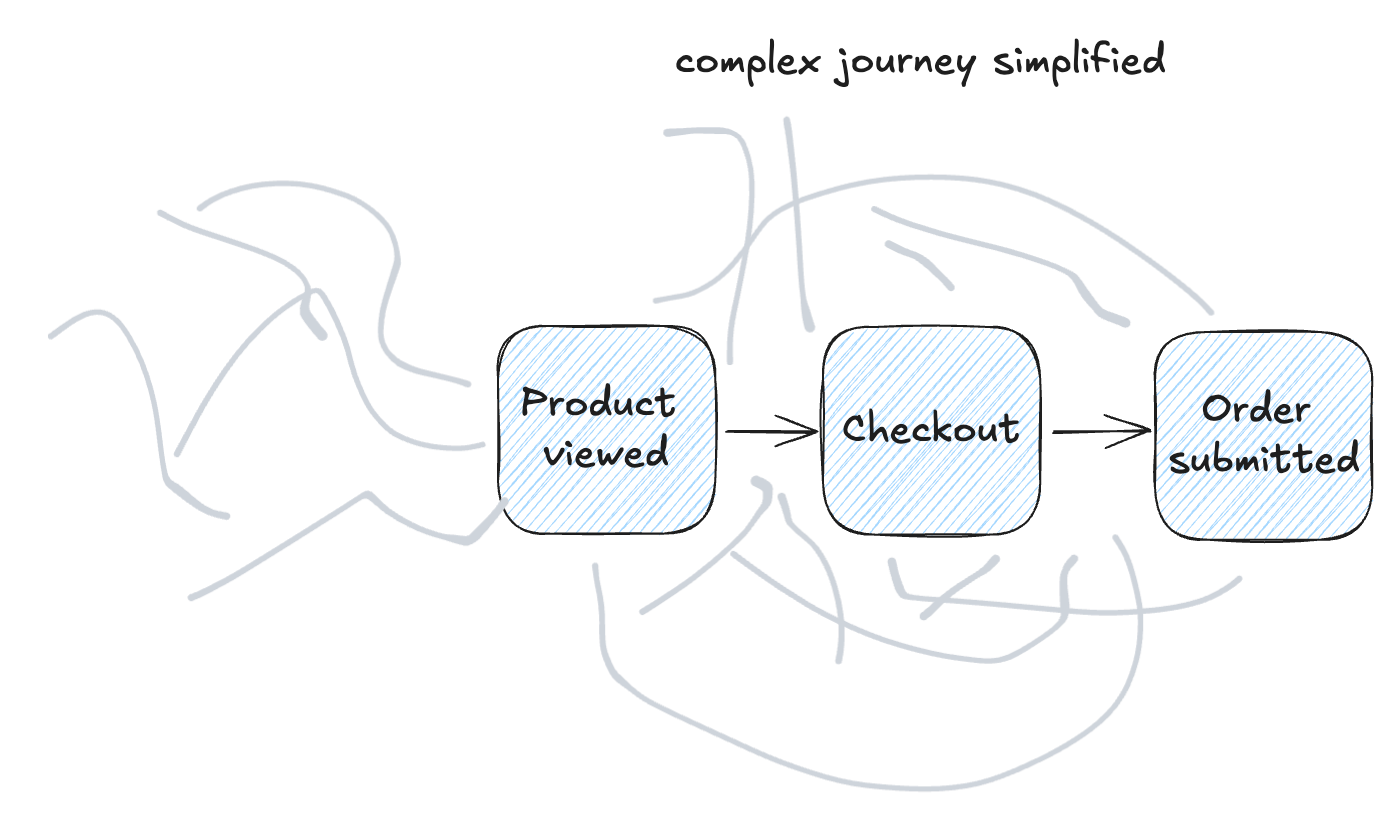
This is a great example of a user journey that we assume is pretty straightforward. But if we take two steps back and examine it, it's far more complex than we think.
The complex user journeys in Software as a Service or why product analytics is so complicated
I started with an e-commerce example because, in analytics, it's the most straightforward setup. But as I've pointed out, it's not. Now, let's switch to a business model that feels way more complex by default: software as a service (SaaS).
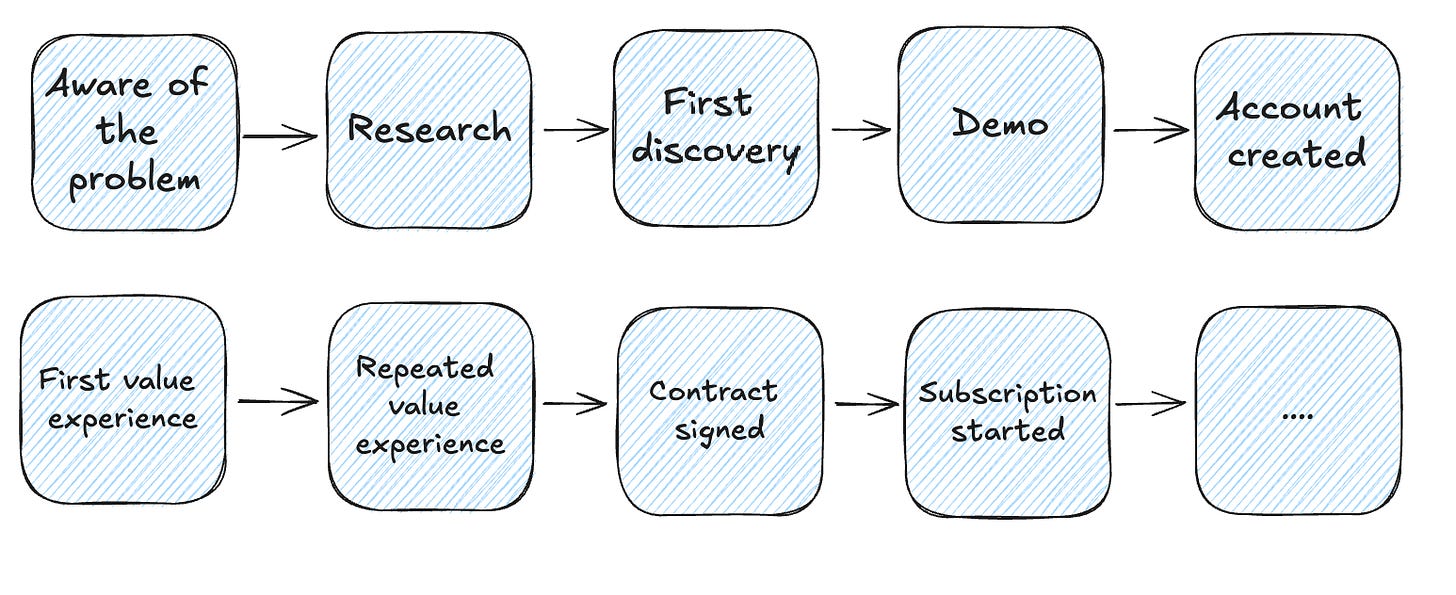
A typical SaaS customer journey can stretch over months. It might start with people just checking out the software - browsing marketing materials, maybe catching a demo, attending a webinar, or even chatting with someone from the company. Then, if possible, they might create an account.
Next, we're all hoping they'll start using the product. They might invest an hour figuring out what they can do. It could be successful, but maybe not. If it works out, they might come back and try something else. Hopefully, with each return, they start developing a habit and realizing, "Hey, this tool is beneficial for what I do." They keep using it, and at some point, it becomes their go-to tool.
Then, depending on how the SaaS is designed, they might hit a wall. The product team builds this wall somewhere to say, "Looks like you're getting a lot of value from this tool. Time to pay us for it." Product teams experiment a lot with when and how to do this. But we assume this person has figured out the software is super helpful, so they're happy to hand over their credit card details and get a subscription.
And that's when the real story kicks off. The subscription runs in the background, renewing every month. You're still hoping people keep using your product in a way that gives them value over time. But this relationship can fade. Maybe their use case disappears, they find things that bug them, or, worst case, they discover an alternative that does the job better. They might start using it less often, then stop altogether. Obviously, they'll cancel the subscription at some point because who wants to pay for something they don't use?
This whole journey is already complex. Tracking it is a huge undertaking. And we're not even touching on the fact that there are different scenarios for product usage. Every product has five to ten dominant use cases or jobs to be done that people tackle with this tool.
When we factor all this in, it explains nicely why so many people struggle with product analytics. It's significantly hard because we're looking at very complex user journeys that can happen over a long period and involve loads of different features within the product.
So, there's no easy way to answer, "Hey, which feature is the most important to convert people to?” There's no simple answer to which usage pattern can predict that someone will subscribe. These are important questions, but they're extremely tough to crack. We need to find a different way to approach this.
Managing complexity
One way to handle complexity is to find a simpler model that can still explain patterns within the mess but it's easy enough to work with and valuable. The classic checkout funnel is a good example. Sure, people can take different routes to check out, maybe even do steps in between, but you usually take a simplified version. You define five steps and analyze that because you figure, okay, everything that happens in between can have an influence, but it's optional that we need to bring it into the model.
So, the challenge we're facing in product analytics is this: We need to find a model that makes it easier to really grasp what's going on in user journeys. At the same time, it needs to be robust enough that when we draw conclusions from this model and apply them to our products, it'll create the impact we're hoping for. We can't make the model too simple or end up with useless data points from all the data we collect.
It took me a long time to develop different ideas for this. It took over eight to ten years. I tested all these other ideas over time, and some worked well, but it was never something where I'd say, "This is it. I'd deploy this everywhere."
My newest iteration of all these thoughts, and the most promising so far, is the idea of user states. Let me explain what user states mean.
What are user states?
This concept might feel more familiar if you've got some experience with games, be it computer games or role-playing games. In a classic role-playing game, a player starts as a novice or a beginner. They've got some basic skills, and they level up over time by going on different adventures. They change their skills, improve them, and develop different characteristics. Most games have this concept called levels. It's usually a motivation for people to keep playing, like, "Hey, what happens at level 45?" Or it unlocks things you can only do at level 45.
We can apply this same idea to user journeys or usage within our products. When someone signs up for your product and creates an account, they're fresh. They're starting with nothing. They're the novices, the beginners who must develop skills to use your product.
If you're doing an excellent job with activation, like having a perfect way to get people to one or two first success moments using your tool, they develop some skills. So they move up one or two levels on their journey. They've moved from a beginner to an activated user because we now believe they've got the basics of the product down.
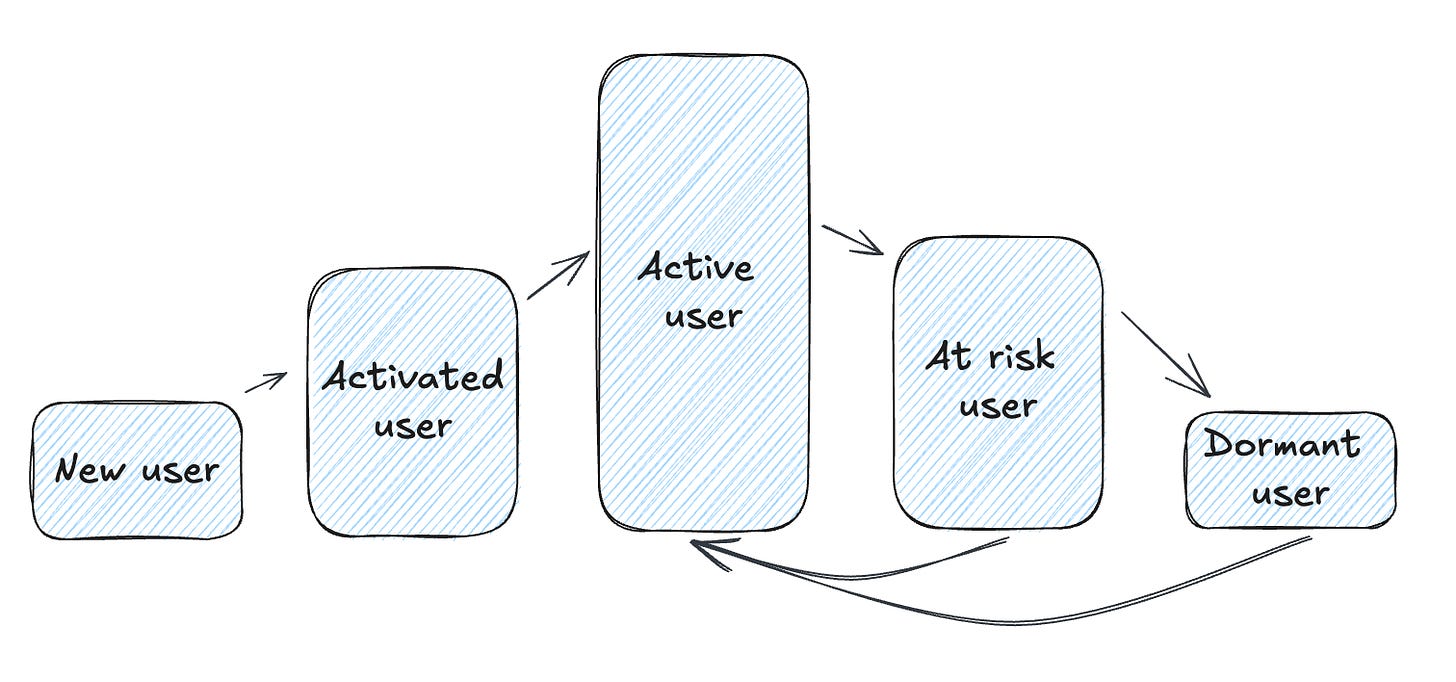
At a high level, the next step for us would be getting to a point where this user is coming back after two or three days, doing similar steps, or even expanding their knowledge within the tool, maybe trying one or two other use cases, becoming more proficient. When they do this over a long period, we see in the data they've been at it for eight weeks, and they keep coming back; we can move them to a level we might call active user, current user, or pro user, whatever you want to call it.
Then, the flip side can happen, like I described before, where they come back infrequently. They don't use us anymore. We can track this with a different state, too. For example, we might flag these users after two or three weeks as "at risk" users. At some point, we can also say these users have churned from our product perspective, even if they might still have a subscription running. But from a product view, we can see they don't use us anymore, so we flag them as churned.
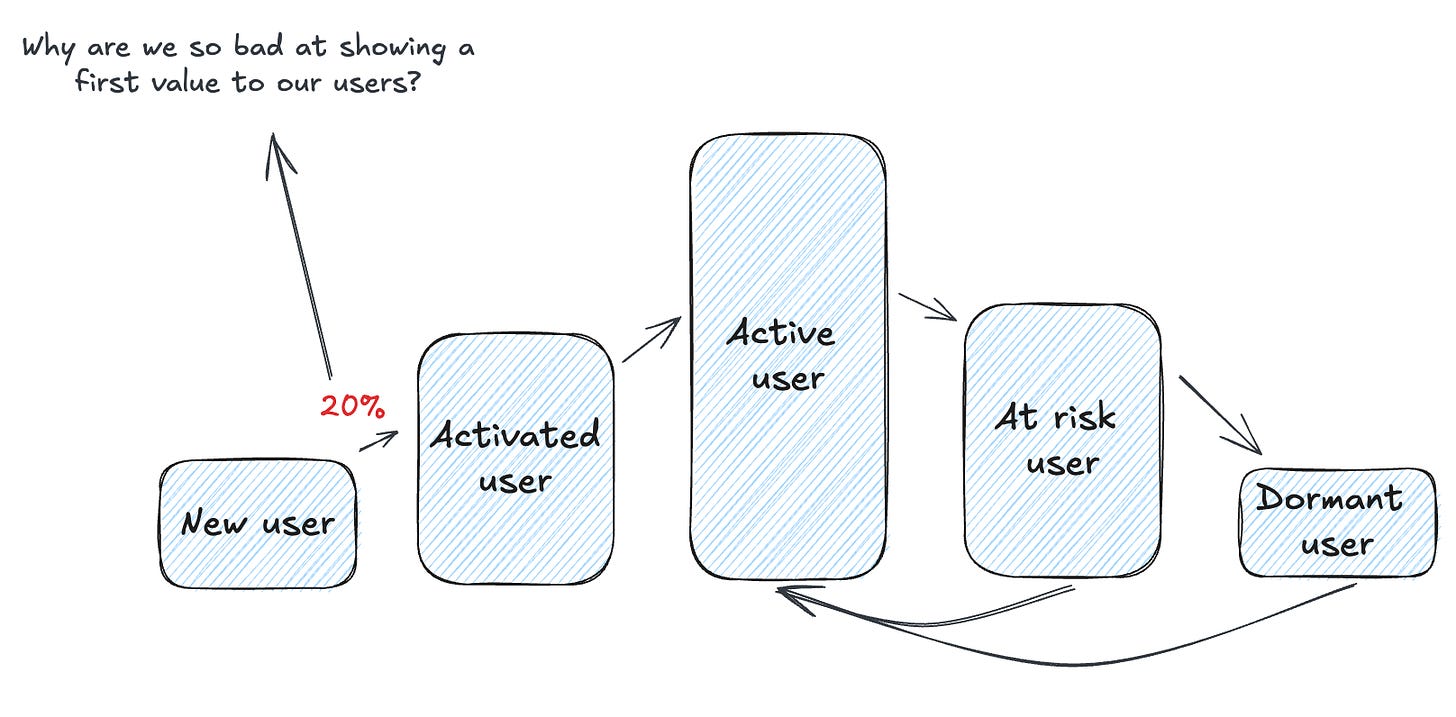
This is a very high-level user state model, but it already makes it much easier to understand how people are progressing and journeying through your product. Obviously, we want to move lots of people to active users or pro users, or whatever we want to call them. And hopefully, we don't want to see them move to "at risk" or to churn.
The five core user states
This is our starting point. This is the highest level of user states I'd kick off with. It's like the bird's-eye view of the user journey in a product. Now, there are deeper levels to this. You could have different stages of activation or various levels of activity for your current or active users. But start here. This is why I call them the five core user states. It's a solid foundation to build on. You can get this nailed down first and then dive into the nitty-gritty if necessary.
New users
These individuals signed up within a specific period. Depending on how you're analyzing and looking at data daily, these people signed up during that day. For monthly analysis, those who signed up during signed up during that month.
The definition of "signing up" can vary depending on your product. If you have an app without formal accounts, people might have installed the app. For products with a standard account system, it is when someone has created an account.
Activated users
I also prefer to include activated users, as this is the first essential step. In my experience, transitioning from new to activated users often presents the most significant improvement potential. It's typically where you'll encounter your most significant losses. I advocate for a specific state to truly understand what constitutes an activated user.
One aspect to consider is whether activated users can only come from new users or if people can become activated later. You'll need to investigate this in your data. From my experience, there's usually a very short period between being a new user and becoming an activated user. However, this might vary depending on the nature of your product.
Active users
I've used the te for the next stage despite some c” despite some challenges with this label. The term is often used rather generically, which can lead to misunderstandings. We must develop a precise, granular definition of an active user in our context. This involves various interactions that users engage in, and it's a definition that requires ongoing refinement.
The "active user" metric you see in most analytics tools lacks this refinement level, making it somewhat risky to use. However, I've decided to stick with this term because it's widely understood and used in the industry. By using familiar terminology, I hope to make the concept more accessible and easier for people to grasp.
Active users are our ideal state, and we would love to keep people forever. If you go deeper and break up active users into different segments, it is also potentially the state with the most depth.
At Risk users
At-risk users were active in a previous period but have not been active in the most recent period we're analyzing. For example, when looking at last month's numbers, we'd consider active users in the months before last month but not during the previous month itself as at-risk.
This concept can be applied to various periods. If your product expects or aims for more frequent user engagement, such as daily or weekly, you can adjust these periods to define at-risk users. The key is identifying the gap between a user's last activity and the current period, which signals they might be at risk of disengagement.
Dormant Users
These users are essentially product churned, but I prefer "dormant" as it's more straightforward. While we typically consider users churned when they cancel their subscriptions, users often stop using our product well before that point. This can occur significantly earlier than a subscription cancellation, making it a valuable indicator of subscriptions at high risk.
The term "dormant users" more accurately describes this state. These users were active at some point but haven't been active for a defined recent period. The specific time frames depend on your reporting periods and product expectations.
For example, dormant users are those not active in the last 90 days but active in the 180 days before. This definition allows you to identify users who have disengaged from your product before they officially churn, allowing you to re-engage them.
You can map out and analyze your product's high-level performance with these five states. By examining the transitions between these states, you'll quickly see if you're losing too many users or doing well in activating or successfully retaining active users. This provides early signals if something isn't working with your product, offering an efficient way to monitor product performance over time.
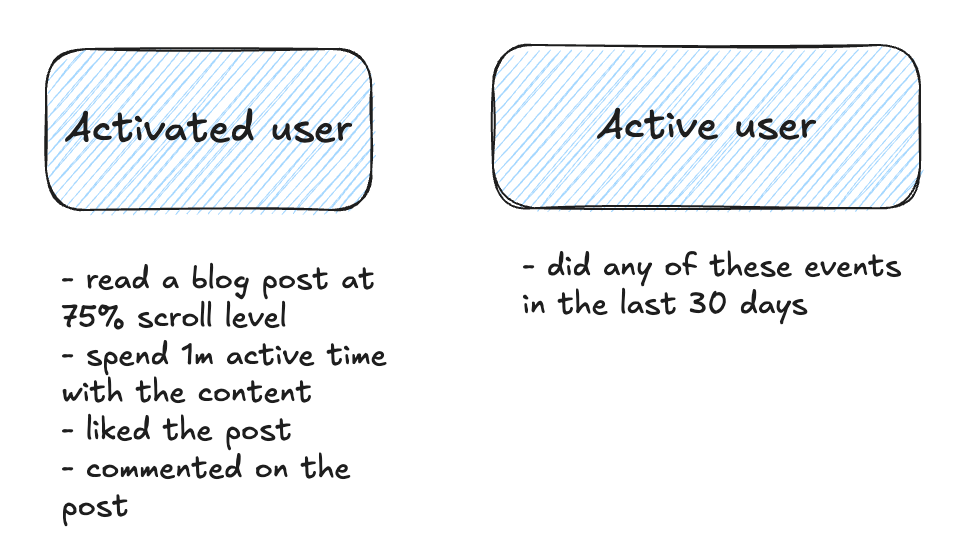
Your critical task is defining what constitutes an activated and active user. Once you've established these, the other states become more easily defined. However, this definition process takes time, requires data analysis, and will likely need refinement to work optimally.
It's important to note that updating your definition of an active user will influence your metrics. For instance, if you start with a broad, simple definition and later decide to raise the bar, your metrics will likely decrease after applying the new definition. This is fine, but it's crucial to communicate these changes effectively so stakeholders understand the metrics shift.
However, even this simple model of user states gives us much more control over investigating and researching.
For example, why are we only moving 20 percent of new users, beginners, into activated users? There is a massive gap of 80 percent where we're not doing a good job. This translates into very operational product or customer success work, like talking to people and asking them what's missing and why they're not getting it. Then, we have to work on different kinds of onboarding scenarios.
And then we have two metrics where we can immediately see, "Hey, we're improving. We're now getting 30, 40 percent of people into the activated state." So we're making progress here. You can do the same with all the other transitions between the different states.
This makes states extremely interesting as a straightforward model to understand how your product is performing.
The user states in practice
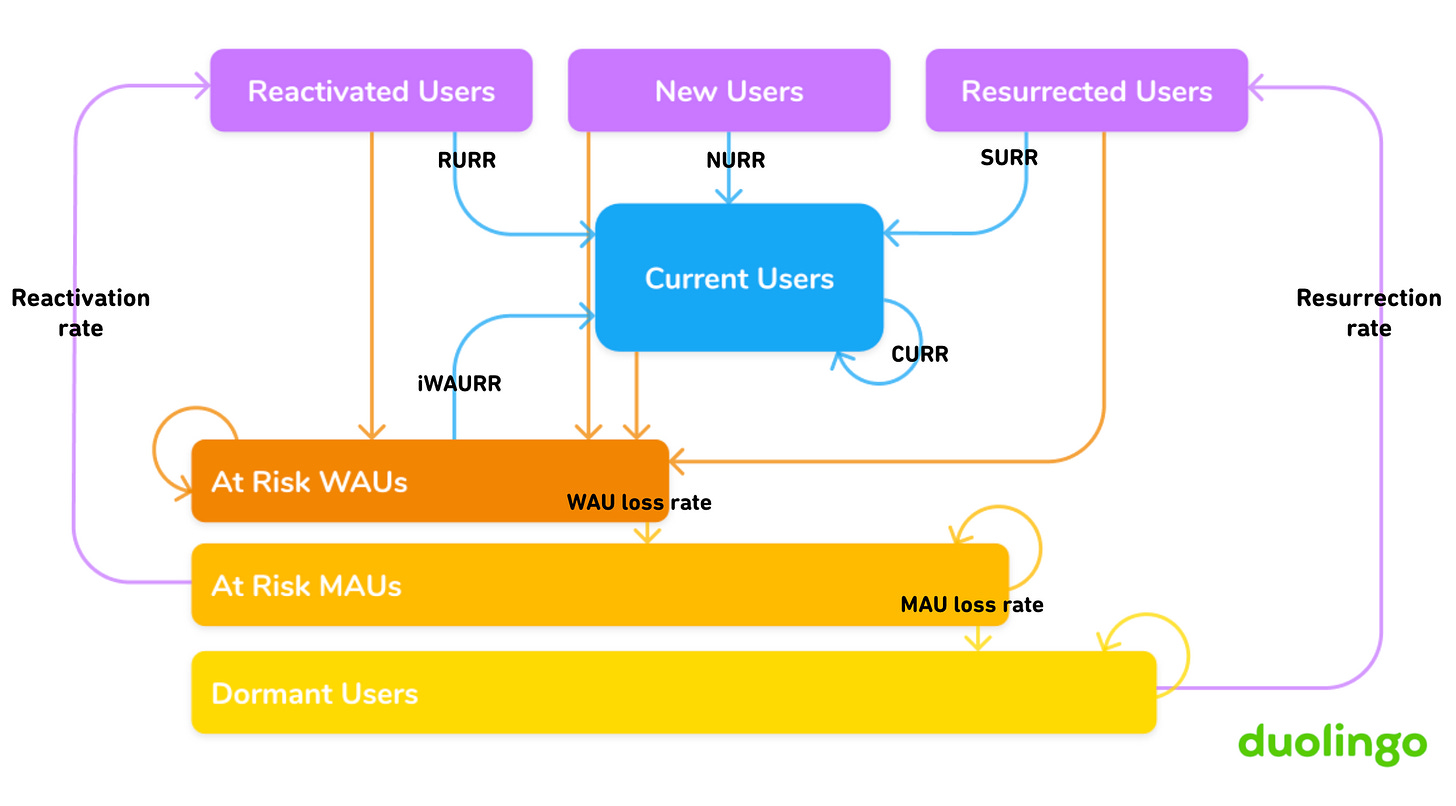
This whole thing isn't new. I know quite a few companies that use this model in their product analytics setup to understand how users progress through their products. Duolingo, for example, published one of the best posts I've read on product analytics about a year ago. They described their growth model, which is what I just talked about—how people move through different states of activity in their product.
They use terms like new users, current users, reactivated users, resurrected users, and then at-risk users (they have two different levels of at-risk), and dormant users. They analyze how people transition between these states. This is the foundation for all their work to keep as many people as possible in the current user state. I highly recommend reading this post.
How to implement it
A good approach is to sit down with all the people involved with the product. That means the product team, obviously, but also customer success if you have it, customer service, development (remember them!), potentially sales, and maybe marketing who've done some research. You can invite a big group.
Then, start discussing what everyone thinks makes an activated user and what makes an active or current user. You'll come up with different versions. Your first task will be to make it as simple as possible. It's not a good job if you end up with a rule set for activated users that's 20 lines long. It should be simple to start with.
The technical implementation
Now, for the technical implementation part. I've got some bad news for you—it's not easy. The obvious choice would be to use product analytics or event analytics tools because, well, they're built for this. But setting these things up isn't straightforward.
In Amplitude or Mixpanel
The usual approach in a tool like Amplitude or Mixpanel would be cohorts or segmentation. In both tools, you can set up something like, "I want to include people in a group who were new (so they have a new account in the last 30 days) and who then did these two events three times within the last 30 days." You'd call this “activated users.”
It's possible to build something like that in there. It gets more complex and intricate rule sets and gets trickier when you work with different periods.
For example, an at-risk user might be someone who was active 30 to 60 days ago but has not been active in the last 30 days. This is the part that complicates things in product analytics tools. It's also super hard to test if your definition works. I did a video about how you can set these things up, but I still need to be happier with how the tools support this. But it's a start. You can begin there, and I know it's possible to build it. It just takes a while, and it takes some testing and experimenting.
In your warehouse
The other way to implement this, obviously, is in your data warehouse with a data model. You'd have to create a model that describes exactly what I've been talking about. One approach, and this is something I want to invest more time in and write about in the future, is to have constant user state tables that you generate. These would also develop a history over time.
In the end, for each user ID, you'd have a history of which states they've been in over time, over the months. When you can develop this, it makes it pretty easy for you later to say, "Hey, we have this many people now in active, this many in churned or dormant," and so on. But this is what you'd have to create in your data warehouse.
What's next
First off, I really hope more and more product teams or companies will implement at least this simple model. That way, they'll have a baseline and foundation to understand product performance. This is kind of my mission - to make this approach more visible to more people so we can see more implementations.
I hope that we see better tool support for user states. I know about at least one new product analytics product that is built around this concept but is not available yet (follow Marko on LinkedIn to see updates). So there is hope.
Now, the next steps can go pretty broad. You might pick specific user states and dive one level deeper. Let's say in an active user scenario, as I mentioned before, your product usually has different jobs to be done. So the next obvious step would be to analyze, "Okay, we have this set of active users, but what jobs are they actually doing?" This gives you a good indication of which parts of your product are really important and better answers the question of what features matter. But you need to approach it from a jobs-to-be-done perspective.
At some point - and this is something I'm still tinkering with - maybe we can even introduce a leveling system in our products. It would be super nerdy and super interesting, but maybe also a bit over-engineered. I don't know yet. I'll have to do some experimenting with that.
But for me, I hope the major takeaway you get from this post is that you sit down and say, "Okay, we really want to implement these five core user states." That's the big win here.



Excellent article, all-encompassing!
I think creating user states tables over time with stable definitions (or even changing definitions as the product evolves) could be game changing for a lot of products. Certainly would have helped me a lot in my previous role.
Also, this was really well written. Thanks!